

The KPIs to watch every day are First Call Resolution, CSAT, Average Handle Time, Average Speed of Answer, and abandonment rate, with repeat call rate as a close sixth. This article gives you the exact formulas, current benchmark ranges, role-based KPI stacks, and the measurement rules that keep those numbers honest. It also flags where AI-handled interactions need their own line on the dashboard, because blending them with human-agent numbers hides real problems.
TL;DR:
- Improving first call resolution requires tracking it with a 7 to 14 day repeat-call window, not just agent flags, to accurately reflect unresolved issues.
- Customer satisfaction should be measured immediately after calls on a 5-point scale, with NPS as a quarterly relationship metric and CES focusing on ease of resolution.
- Operational KPIs like service level rate and abandonment need to be set by channel and customer tier, monitoring wait times carefully to prevent disproportionate abandonment spikes.
- Agent capacity metrics such as utilization and transfer rate must be balanced with quality data like QA scores to avoid overworking staff or increasing escalations.
- Training metrics like ramp time and coaching speed directly impact key driver KPIs and should be incorporated into operational dashboards for faster performance improvement.
Table of Contents
- What Call Center Performance Metrics Actually Measure
- The Six KPIs Every Manager Should Have Memorized
- Measuring CSAT, NPS, CES, and QA Without Fooling Yourself
- Service Level, Queue Health, and the 80/20 Rule
- Agent Metrics That Show Capacity Without Burning People Out
- Turning Metrics Into Dollars: Cost and ROI Math
- Building a Role-Based KPI Dashboard Step by Step
- Measurement Rules That Keep Your Numbers Honest
- How Focused Training Moves the Numbers That Matter
- What Most Managers Get Backwards About These Numbers
- See What Faster Ramp Time Does to Your FCR
- Sources
- FAQ
What Call Center Performance Metrics Actually Measure
A metric is just a number you can count. A KPI is a metric you have decided to act on. That distinction gets lost constantly, and it's why some dashboards have forty tiles and nobody knows which one to look at first. Average hold time is a metric. Average hold time tied to a target of under 30 seconds, reviewed weekly by a named supervisor, is a KPI.
Analyst guidance from Forrester recommends a small, role-differentiated set of KPIs rather than one master list everyone stares at. Four to eight KPIs per role is a workable ceiling. Beyond that, attention splits and nobody owns the fix when a number moves.
Different roles need different numbers:
- Frontline supervisors need AHT, QA score, adherence, and FCR at the team level, checked daily.
- Operations directors need service level rate, ASA, abandonment, and cost per contact, checked weekly.
- CX leaders need CSAT, NPS, CES, and FCR segmented by call reason, checked biweekly.
- Finance needs cost per call, headcount utilization, and repeat call rate, checked monthly.
- AI/automation leads need containment rate and AI-handled CSAT tracked separately from human-agent numbers.
Measurement hygiene matters as much as metric choice. Pick one formula per metric and never let two teams calculate FCR differently. Use consistent time windows, particularly a 7 to 14 day repeat-call window for FCR, and segment every core number by call type before you trust an average.
The Six KPIs Every Manager Should Have Memorized
These six metrics drive most of the cost and experience outcomes a contact center cares about. Get these right before adding anything else to a dashboard.
-
First Call Resolution (FCR). Formula: (issues resolved on first contact ÷ total contacts) × 100. FCR is widely regarded as the single most important call-center KPI because it links directly to cost and satisfaction. Measure it with a 7 to 14 day repeat-call window rather than an agent-marked flag at the end of the call. Agent self-reported FCR tends to run higher than window-based measurement, because agents mark a case resolved even when the customer calls back three days later still confused. Benchmarks generally sit around typical median ranges for a healthy operation. If FCR drops, the immediate action is a QA review of the calls that generated repeats, not a blanket coaching memo.
-
Customer Satisfaction (CSAT). Formula: (satisfied responses, typically 4s and 5s on a 5-point scale ÷ total responses) × 100. Industry ranges cluster around typical scores for phone support. A dip in CSAT with stable FCR usually points to tone, wait time, or agent demeanor rather than resolution capability. The action is a targeted QA listen, not a process overhaul.
-
Average Handle Time (AHT). Formula: (total talk time + hold time + after-call work) ÷ number of calls handled. Typical AHT for general customer service varies depending on industry and call complexity. Cutting AHT without watching FCR is the single most common self-inflicted wound in contact centers. Rushed calls generate repeat calls, and repeat calls cost more than the seconds you saved.
-
Average Speed of Answer (ASA). Formula: total wait time for answered calls ÷ number of answered calls. A commonly cited target is under a moderate range of seconds. ASA and abandonment move together but not linearly. Past roughly 60 seconds of wait, abandonment accelerates sharply rather than climbing at a steady rate.
-
Abandonment rate. Formula: (calls abandoned before answer ÷ total incoming calls) × 100. Low abandonment rates are generally considered healthy; higher rates signal staffing or forecasting problems worth escalating immediately.
-
Repeat call rate. Formula: (contacts from a customer within your chosen window who already contacted about the same issue ÷ total contacts) × 100. This is FCR's mirror image, and tracking both side by side stops anyone from gaming FCR by narrowing what counts as "the same issue."
Watch how these interact before you optimize any single one. A team that improves AHT by 20% while FCR drops five points has not actually improved anything, it has shifted cost from talk time to repeat volume. Report every one of these segmented by call type, channel, and agent tier. A blended average across billing calls and technical support calls tells you almost nothing actionable, because mixed queues mask the variance that matters.
Measuring CSAT, NPS, CES, and QA Without Fooling Yourself
Customer experience metrics are only as good as the question wording and the moment you ask. Get either wrong and you're optimizing against noise.
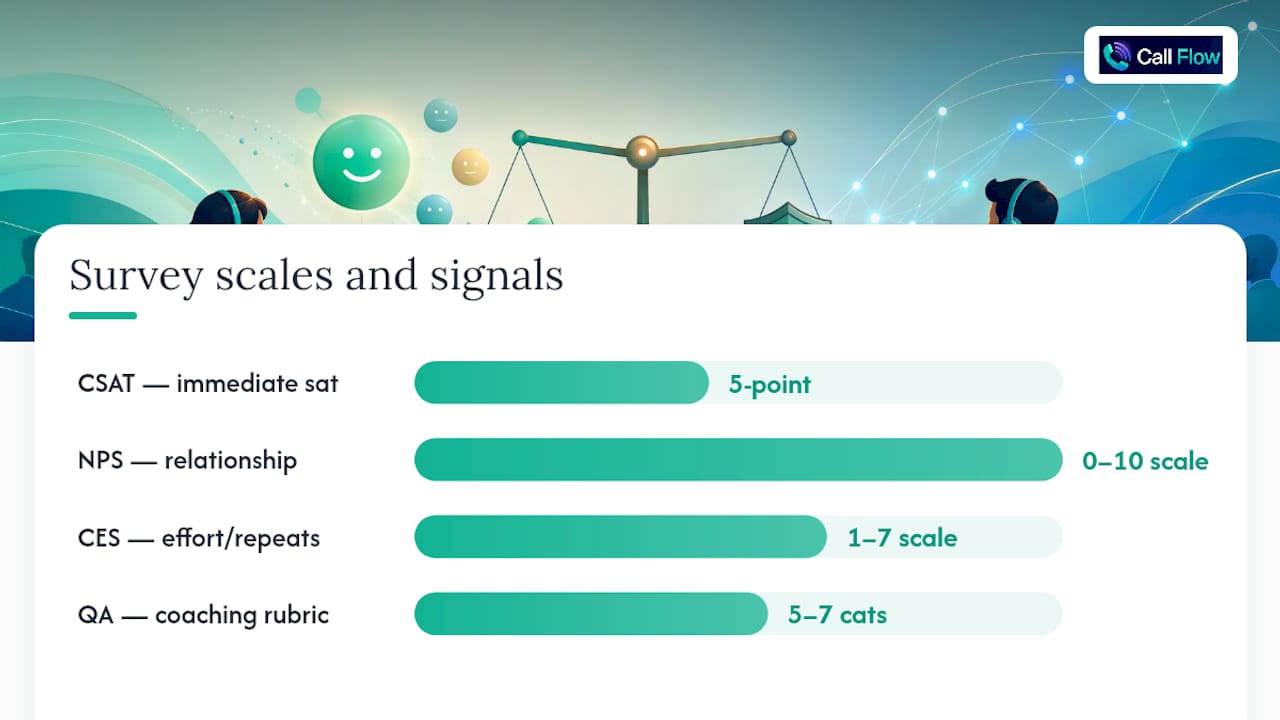
CSAT should be asked immediately after the interaction, on a simple 5-point scale, with wording as close as possible to "How satisfied were you with this call?" Delayed surveys pick up unrelated frustrations. A customer who hangs up happy but has a bad experience with your billing portal an hour later will rate the call itself lower if you wait until end of day to ask.
Net Promoter Score (NPS) asks "How likely are you to recommend us to a friend or colleague?" on a 0 to 10 scale, then nets the percentage of promoters (9 to 10) minus detractors (0 to 6). NPS works better as a relationship-level metric measured quarterly than as a per-call score. Asking it after every support call inflates response fatigue and skews the sample toward extremes.
Customer Effort Score (CES) asks "How easy was it to resolve your issue today?" on a 1 to 7 scale. CES correlates tightly with repeat calls. A low-effort score with a high resolution mark usually means the customer got the right answer but had to fight through IVR menus or hold time to get it.
Sample size matters more than most managers assume. Fewer responses than that, and a bad week from three chatty customers can swing your number by several points.
Pro Tip: Run CSAT and CES on the same survey but never ask both in the same sentence. Effort and satisfaction feel similar to a customer answering fast on their phone, and combined wording collapses two distinct signals into one mushy average.
Quality assurance (QA) scoring is where most of the actionable coaching data lives. Build a rubric around five to seven weighted categories: greeting and verification, active listening, accuracy of information, resolution attempt, tone, compliance, and close. Score each call on a defined scale, not a gut feeling, and calibrate evaluators monthly so two people scoring the same call land within a few points of each other.
The old model sampled 1% to 3% of calls by hand. That's no longer the ceiling. Automated scoring can now cover up to 100% of interactions, which removes the sampling bias that comes from evaluators cherry-picking easy calls to review. But volume alone doesn't fix anything. A QA score that never triggers a coaching conversation is paperwork, not a metric.
Slice your experience data multiple ways before drawing conclusions:
- By call reason (billing disputes score differently than simple status checks)
- By channel (voice CSAT and chat CSAT rarely match)
- By agent tenure (new hires under 90 days should be benchmarked separately from tenured staff)
- By AI-handled versus human-handled contacts, since blending the two hides where automation is actually helping or hurting
Combining operational data with experience data gives you the full picture: the O-data tells you what happened, the X-data tells you how it felt. Neither one alone is enough to run a coaching program on. For managers looking to move CSAT specifically, a focused CSAT improvement playbook walks through the coaching and knowledge-base changes that tend to move the needle fastest.
Service Level, Queue Health, and the 80/20 Rule
Service level metrics measure how fast and reliably your queue moves, and they're the numbers that show up first when something is wrong operationally.
Service level rate is usually expressed as a target and a time window, most famously the 80/20 rule: 80% of calls answered within 20 seconds. Formula: (calls answered within target time ÷ total calls offered) × 100. Some centers use 70/30 or 90/15 depending on channel and customer tier. Premium support lines often run tighter targets like 90/10, while general inquiry lines can tolerate 70/30 without much customer complaint.
Average Speed of Answer (ASA) is the average wait time across all answered calls, distinct from service level rate because it reports a single average number rather than a pass/fail threshold. Both matter. ASA can look fine on average while service level rate reveals a chunk of customers waiting far too long.
Abandonment rate measures the percentage of callers who hang up before reaching an agent. Formula: (abandoned calls ÷ total incoming calls) × 100. This is the number that moves fastest when staffing falls short of forecasted volume, and it tends to spike disproportionately once wait time crosses a customer's patience threshold rather than climbing steadily.
Average hold time tracks how long a connected customer waits after being placed on hold during a call, separate from queue wait before the call connects. Long hold times often point to knowledge gaps rather than staffing problems, since agents put people on hold to search for answers they should already have.
After-call work (ACW) is the time an agent spends finishing documentation after the call ends, before taking the next one. Formula: total ACW time ÷ number of calls. ACW rolls into AHT, but tracking it separately tells you whether your CRM workflow or your talk time is the bottleneck.
A few operational rules keep these numbers useful:
- Set service level targets by channel first, since chat and voice tolerate different wait expectations.
- Segment targets by customer tier when your business supports different service agreements for different accounts.
- Translate forecasted call arrival rate into staffing using an Erlang C model or equivalent, then adjust in real time as actual volume deviates from forecast.
- Watch the non-linear relationship between ASA and abandonment. Once average wait crosses roughly 60 seconds, abandonment often jumps disproportionately rather than rising at a steady rate.
Reducing ACW is frequently the fastest, safest lever to pull because it rarely touches the customer-facing part of the call. A practical breakdown of automating ACW to cut AHT without hurting FCR is worth reviewing before you touch anything customer-facing.
Call-quality telemetry belongs in this conversation too, especially for centers running VoIP or hybrid infrastructure. Microsoft's Call Quality Dashboard uses classifier-based measurements like Problem Rate and Caused Problem Rate to isolate whether a bad call was a network issue or an agent issue, a distinction that matters before you blame a person for what was actually a packet-loss problem. Infrastructure-level platforms can go further, with continuous SIP testing reporting 90-plus per-call quality metrics including jitter, packet loss, and MOS scores, giving IT teams an independent read on media quality separate from what agents report anecdotally.
Agent Metrics That Show Capacity Without Burning People Out
Agent-level metrics tell you how your team spends its time, and they're where over-optimization does the most damage if you're not watching quality alongside them.
Utilization measures the percentage of scheduled time an agent spends actively handling contacts, including talk time and ACW. Formula: (talk time + ACW) ÷ total logged-in time. Occupancy is a close cousin measuring active handling time against total time available for calls, excluding breaks. Healthy utilization generally lands between 75% to 85%. Push much past that and burnout risk climbs fast.
Schedule adherence tracks how closely an agent follows their assigned schedule, formula: (actual time in scheduled state ÷ total scheduled time) × 100. A team missing adherence consistently either has a broken schedule or an engagement problem, and those require different fixes.
Calls per hour is a raw throughput number, useful for capacity planning but dangerous as a standalone coaching target since it rewards speed over resolution.
Transfer rate measures the percentage of calls moved to another agent or department. Formula: (transferred calls ÷ total calls) × 100. A rising transfer rate usually means either a routing problem sending calls to the wrong queue, or a knowledge gap forcing agents to escalate what they should be able to handle.
QA score rolls up the rubric-based evaluation covered earlier into an agent-level trend line, reviewed alongside productivity numbers rather than instead of them.
Turnover tracks the percentage of agents leaving within a given period, often reported annually. Contact center turnover frequently runs higher than most other departments, and it's worth tracking against ramp time and QA score together, since undertrained agents who feel unprepared tend to leave faster.
The trap here is optimizing throughput in isolation:
- Never reward calls-per-hour improvements without checking whether FCR or QA score dropped in the same period.
- If transfer rate spikes, check routing rules first, then knowledge base gaps, before assuming it's an agent skill issue.
- If utilization climbs past 90% for a sustained stretch, expect adherence and turnover to worsen within a quarter.
- Pair every productivity metric with a quality metric on the same dashboard tile, never on separate pages.
Turning Metrics Into Dollars: Cost and ROI Math
Contact centers live or die on cost per contact, and getting that number right requires more discipline than most teams apply.
Cost per call (or cost per contact for omnichannel centers) formula: total operating costs (labor, technology, overhead) ÷ total contacts handled in the period. Allocate overhead proportionally across channels rather than dumping it all onto voice, since chat and email carry infrastructure costs too. Typical cost per contact ranges widely by industry, often landing somewhere between $2 and $6 for straightforward voice interactions, higher for technical support.
Repeat call rate connects directly to cost. If cutting AHT by 15 seconds per call saves labor cost but increases repeat calls by even a few percentage points, you've likely made the math worse, not better, because a repeat call carries the full cost of a fresh contact plus the customer frustration of calling twice.
A simple ROI framework for a training or automation investment:
- Calculate current cost per contact and current FCR.
- Estimate the FCR lift a training or tooling investment is expected to produce.
- Multiply the reduction in repeat calls by cost per contact to estimate monthly savings.
- Compare that savings against the monthly cost of the investment to find payback period.
At $4 per contact, that's $2,400 in monthly savings before counting the CSAT lift that usually comes with it.
Building a Role-Based KPI Dashboard Step by Step
Picking KPIs isn't a brainstorming exercise, it's a five-step process that starts with outcomes, not metrics.
- Decide the outcomes and stakeholders first. Are you optimizing for cost reduction, CSAT improvement, or agent retention this quarter? Name the stakeholder who owns each outcome before picking a single metric.
- Pick 4 to 8 KPIs per role. Match each KPI to the outcome it actually predicts, not the one that's easiest to pull from your existing system.
- Standardize definitions and windows across every team. One formula for FCR, one time window, applied identically whether the report comes from a supervisor or the ops director.
- Set targets with alert thresholds attached. A target without an alert is a number nobody checks until the quarterly review, by which point the problem is three months old.
- Assign an owner and a review cadence to every KPI. Daily for frontline supervisors, weekly for operations, monthly for finance and leadership.
Build in an escape hatch for when KPIs conflict. If AHT and FCR are pulling in opposite directions on a specific call type, decide in advance which one wins for that segment rather than litigating it every time the numbers move.
Pro Tip: Before locking in a target, run a two-week pilot to confirm that moving the KPI actually moves the business outcome you care about. Teams sometimes discover that a 10-point FCR improvement produces almost no CSAT change for a specific call type, which tells you FCR isn't the lever for that segment.
Segmentation deserves its own line item in this process. A dashboard that reports FCR as one blended number across billing, technical support, and returns is reporting an average of three different businesses. Split it, and the KPI actually points to where the problem lives.
Measurement Rules That Keep Your Numbers Honest
The formula matters less than the discipline around applying it the same way every time.
For FCR specifically, use a 7 to 14 day repeat-call window rather than an agent-marked resolution flag at end of call. The window catches customers who called back three days later still unresolved, something an agent's own end-of-call assessment will never flag. For most metrics involving time (AHT, ASA, hold time), report the median alongside the mean, since a handful of extremely long calls can drag a mean upward without reflecting a typical customer's experience.
QA sampling has real limits. Automated QA scoring up to 100% of interactions closes that gap, but only if the scoring criteria are calibrated regularly against human judgment, and only if scores actually feed into coaching conversations within days rather than sitting in a report nobody opens.
Dashboard design rules that prevent scoreboard theater:
- Build role-specific views. A frontline supervisor and an operations director should never look at the same screen.
- Cap active tiles at around 12 per dashboard. Beyond that, attention fragments and nothing gets acted on.
- Set hard alert thresholds, not soft color gradients that everyone learns to ignore.
- Name an owner for every alert before it fires, not after.
- Track AI-handled and human-handled metrics on separate tiles. Blending containment rate, AI CSAT, and human CSAT into one number obscures channel-level performance right when automation is scaling fastest.
For teams building out training-specific dashboard views, a training data visualization guide covers layout choices that keep ramp and coaching metrics visible without cluttering the operational view.
How Focused Training Moves the Numbers That Matter
Training investment shows up in the metrics above faster than most managers expect, provided the feedback loop is tight, making programs like Corporate Sales Pro from GetVoucher useful adjacent resources to build coaching curricula.
Those two numbers connect directly to the KPIs covered throughout this article: faster ramp means new agents hit target AHT and QA scores sooner, and resolution improvement flows straight into FCR and, from there, into CSAT and cost per contact.
The gap between a scripted onboarding manual and a role-play scenario that grades an agent's tone, accuracy, and resolution attempt in real time is the gap between reading about a skill and practicing it under pressure. Instant feedback compresses a coaching cycle that used to take a supervisor a week of call reviews into something an agent gets before their next call.
Add these training-specific KPIs to your ops dashboard rather than treating training as a separate program with its own report:
- Ramp time to first-solo-shift competency
- Certification pass rate on scenario-based assessments
- Coaching close-the-loop time, meaning how fast feedback reaches an agent after a flagged call
- Correlation tracking between training completion and FCR/CSAT movement at the individual agent level
Faster feedback loops shorten the distance between a mistake and the correction, which is the real mechanism behind the ramp and resolution numbers above.
What Most Managers Get Backwards About These Numbers
Prioritize FCR and CSAT over everything else on your dashboard, then build the rest of your KPI stack around protecting those two. Most teams do the opposite. They chase AHT reduction because it's the easiest number to move and the one finance asks about first, and they pay for it in repeat calls and quietly declining satisfaction scores nobody connects back to the AHT initiative three months later.
Standardize your formulas before you standardize anything else. A supervisor calculating FCR with an agent-marked flag and an analyst calculating it with a 14-day window are reporting two different businesses under the same metric name, and neither one will trust the other's report.
Watch for "too many tiles" syndrome. A dashboard with 30 metrics is a dashboard nobody reads. Cut it to the handful that actually change what someone does on Monday morning.
A short weekly checklist: review FCR and CSAT trends segmented by call type, check adherence and utilization together rather than separately, scan QA scores for any agent trending down two weeks running, and confirm any AHT initiative hasn't quietly pushed repeat call rate up.
— Costa
See What Faster Ramp Time Does to Your FCR
Every metric in this article gets easier to hit when agents walk into their first real call already having practiced the hard version of it. There are AI role-play scenarios with instant grading across multiple performance dimensions, so an agent gets coaching feedback more quickly than waiting for a supervisor's call review several days later.
If you're building out a training-linked KPI stack, an AI role-play training overview walks through how the grading dimensions map to the metrics covered above. For managers designing a formal onboarding sequence around it, a 30-60-90 training plan gives a structure to slot the practice scenarios into.
Start a risk-free trial at Callflow and run your next new-hire cohort through scenario practice before their first live call.
Sources
- Call center metrics and KPIs — Salesforce
- Call Quality Dashboard (CQD) intelligent media quality classifiers — Microsoft Learn
FAQ
What are the 5 key performance indicators of a call center?
Most teams anchor on First Call Resolution, CSAT, Average Handle Time, Average Speed of Answer, and abandonment rate, with repeat call rate frequently added as a sixth.
What are 5 examples of metrics to measure performance?
QA score, schedule adherence, cost per contact, service level rate, and Net Promoter Score cover quality, staffing, cost, responsiveness, and loyalty in one set.
What are the key KPIs for a call center?
FCR and CSAT drive experience outcomes, while AHT, ASA, and abandonment rate drive operational efficiency, and tracking them together, segmented by call type, keeps any single improvement from quietly hurting another metric.
How often should CSAT and FCR be reviewed?
CSAT works best reviewed weekly at the team level, while FCR should be tracked with a 7 to 14 day repeat-call window rather than daily agent-reported flags, since agent self-reporting tends to run 15 to 20 points higher than window-based measurement.