

Training ROI calculation comes down to one formula: ROI% = (total monetary benefits minus fully loaded training costs) divided by fully loaded training costs, times 100. To run it, you need three things: a baseline and post-training measurement of the same metric, a dollar value for the benefit, and a fully loaded cost figure that includes wages, materials, and lost production time. Everything else, including the measurement window and how much of the result you attribute to training, is a caveat layered on top of that core math.
TL;DR:
- Training ROI can be overstated if fully loaded costs omit wages for time spent training, highlighting the importance of including productivity loss.
- A benefit-cost ratio above 1.0 indicates benefits exceed costs, with ratios like 3.0 meaning three dollars are returned per dollar spent.
- Measurement windows should match the expected time for behavior change to materialize, typically 30 to 180 days depending on the program type.
- Conversion patterns for training outcomes include time saved, sales uplift, error reduction, and turnover avoided, each with specific dollar valuation methods.
- Accurate ROI calculations require baseline data, realistic adoption rates, attribution methods, and sensitivity analysis to account for uncertainty.
Table of Contents
- How Do You Calculate Training ROI Step by Step?
- How Do You Convert Training Outcomes Into Dollars?
- What Measurement Window Should You Use, and How Do You Attribute Results to Training?
- Which ROI Model Fits Your Training Program?
- What Data Should You Collect to Measure Training Impact?
- Three Worked Examples: Onboarding, Turnover, and Errors
- What Would a Sales Call Flow Executive Report Look Like?
- How Should You Present Training ROI to Finance and Leadership?
- Turn Practice Sessions Into ROI Data Automatically
- Sources
- FAQ
How Do You Calculate Training ROI Step by Step?
The formula only works if the inputs behind it are solid. Get those wrong and the percentage that reaches your CFO's desk will look precise while being fiction.
Start with the baseline. Before training begins, record the metric you expect to move: average handle time, close rate, error rate, time to first solo call. Then measure the same metric after training, using the same definition and the same data source. Comparing a metric pulled from your CRM before training to one pulled from a supervisor's spreadsheet after training will corrupt the entire calculation before you've written a single formula.
Once you have both numbers, work through the math in order:
- Calculate the gross change. Post-training metric minus baseline metric, in the metric's native unit (minutes, dollars, percentage points, incident counts).
- Convert the change to dollars. Multiply by the relevant dollar driver: hourly rate, contribution margin, cost per error, or cost per hire.
- Subtract fully loaded costs to get net benefit: Net Benefit = Total Monetary Benefits − Fully Loaded Costs.
- Calculate ROI% using the formula above.
- Calculate the Benefit-Cost Ratio (BCR), a companion metric finance teams often ask for alongside ROI: BCR = Total Monetary Benefits ÷ Fully Loaded Costs. A BCR above 1.0 means benefits exceed costs; a BCR of 3.0 means every dollar spent returned three.
- Calculate payback period: Fully Loaded Costs ÷ (Total Monetary Benefits ÷ Measurement Period in Months). This tells you how many months it takes the program to pay for itself.
Fully loaded costs deserve their own line of scrutiny. That figure should include instructor or licensing fees, materials, technology costs, and the wages of every participant for every hour they spent in training, not in their job. Missing that last piece is the single most common way training ROI gets overstated, according to SHRM's guidance on measuring training ROI, which recommends including productivity loss during the training period as a real cost, not a footnote.
One more decision matters more than most people realize: current dollars versus real dollars. If your benefits stretch across 12 months or longer, inflation and the time value of money start to matter. The U.S. Department of Labor's analysis of employer ROI from registered apprenticeships_to_Employers_from_Registered_Apprenticeships.pdf) discounts future benefits to present value specifically because a dollar saved in month 11 is worth less than a dollar saved in month one. For programs under six months, most practitioners skip discounting. For longer periods, annualize the benefit and apply a discount rate before you report the final percentage.
How Do You Convert Training Outcomes Into Dollars?
Every training outcome eventually reduces to one of four conversion patterns. Learn these four and you can price almost any result a training program produces.
- Time saved. Multiply hours saved per employee by the fully loaded hourly rate (base wage plus benefits and overhead, typically 1.25 to 1.4 times base pay). A rep who cuts average handle time by six minutes across 40 calls a day is saving four hours daily, priced at that loaded rate.
- Sales uplift. Multiply incremental units or deals closed by the contribution margin per unit, not the revenue per unit. Revenue overstates the benefit because it ignores cost of goods and delivery.
- Error reduction. Multiply incidents avoided by the fully loaded cost per incident, which should include rework, refunds, and any compliance or reputational cost you can reasonably quantify.
- Turnover avoided. Add recruitment cost, ramp-time lost productivity, and manager time spent hiring and onboarding a replacement, then multiply by the number of departures the training plausibly prevented.
Pro Tip: Don't stop at the trainee's own output. Research from Harvard Business School Working Knowledge on 655 employees found roughly 45% of total measured training benefit came from manager spillover, meaning managers hit strategic goals faster because their trained team needed less hand holding. If you only count the trainee's metric, you're likely undercounting the real benefit by close to half.
None of this assumes every trained employee actually applies what they learned. If 80 people complete a program but only 55 demonstrate the new behavior in the following weeks, your benefit calculation should reflect that gap. Apply a realized-adoption rate, calculated as usage rate multiplied by demonstrated competence, to the gross benefit before you run it through the ROI formula. Skipping this step is how well-intentioned ROI reports end up wildly optimistic the moment finance asks for a plan review six months out.
What Measurement Window Should You Use, and How Do You Attribute Results to Training?
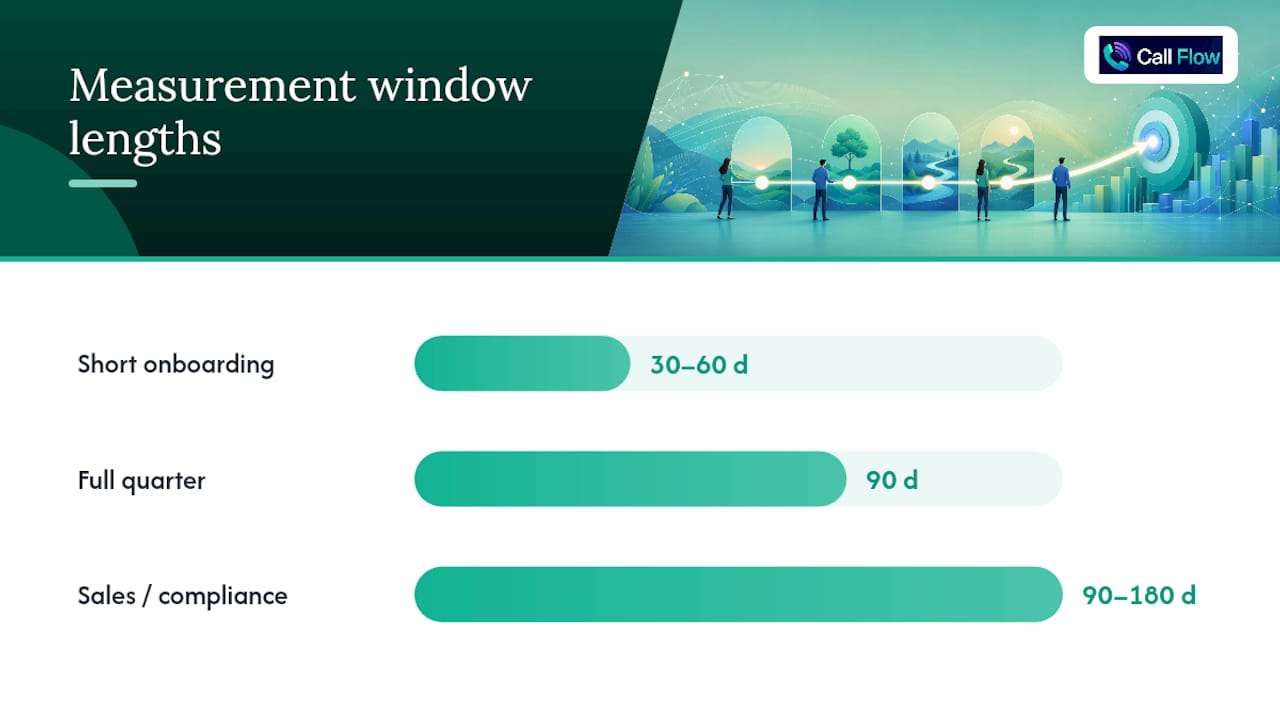
The measurement window depends on how long the behavior change takes to show up in operational data, and how long it lasts once it does. A short onboarding program built around a single skill can be measured in 30 to 60 days. A sales methodology overhaul or a compliance-driven behavior change usually needs 90 to 180 days before the data settles into a stable pattern.
Longer windows capture more of the benefit but introduce more noise: market shifts, seasonality, staffing changes, and new competitors can all move the same metric you're trying to attribute to training. Shorter windows are cleaner but risk understating benefits that compound, like manager spillover or retention effects that only show up after a full quarter.
Isolating training's actual contribution from everything else happening in the business is the hardest part of the whole exercise, and it's where most ROI reports lose credibility. Four methods handle it with varying rigor:
- Control group comparison. Measure a trained group against an untrained group performing the same role in the same period. This is the cleanest method when you can staff it.
- Difference-in-differences. Compare the change in the trained group's metric to the change in a comparable untrained group's metric over the same window, isolating the delta attributable to training.
- Regression analysis. Statistically control for other variables (tenure, market, lead quality) to estimate training's independent effect on the outcome.
- Manager validation. Ask frontline managers what percentage of the observed improvement they'd attribute to the training itself versus other factors. It's the least rigorous method, but it's fast and often the only one available for a smaller team.
Whichever method you use, apply the resulting attribution percentage directly to the gross benefit: Realized Benefit = Gross Benefit × Attribution %. A projective ROI framework for training technologies, detailed in a peer-reviewed methodology published on PMC, goes a step further for new tech rollouts by multiplying the projected benefit by a probability-of-success factor, producing a more conservative number before the program has even launched.
Report the result as a range, not a single number.
Which ROI Model Fits Your Training Program?
Not every program needs the same evaluation framework. Picking the wrong one either wastes analysis effort on a simple onboarding tweak or under-documents a program that genuinely needs rigor.
- Kirkpatrick's four levels remain the most widely taught framework: Level 1 measures reaction (did participants like it), Level 2 measures learning (did they absorb the material), Level 3 measures behavior (are they applying it on the job), and Level 4 measures results (did it move a business metric). ROI calculation lives almost entirely at Level 4, but Levels 2 and 3 are what tell you whether a weak Level 4 result is a training design problem or an attribution problem.
- The Phillips ROI methodology builds directly on Kirkpatrick by adding a fifth level: isolate the effect of training, convert the isolated benefit to dollars, and calculate BCR and ROI% explicitly. It's the closest thing the field has to a standardized ROI process, and it's the model most SHRM materials reference for calculating training and development returns.
- Projective frameworks with a probability-of-success adjustment suit new training technology rollouts, where you're forecasting ROI before you have post-launch data. Adjusting projected benefit by an estimated adoption probability keeps the forecast honest.
Match the model to the program: use lightweight Kirkpatrick Level 1 to 2 tracking for routine compliance training, full Phillips methodology for high-cost sales or leadership programs where the board will ask questions, and a projective framework when you're building the business case for a new training platform before it's even purchased.
What Data Should You Collect to Measure Training Impact?
A believable ROI number is built on a data collection plan, not assembled after the fact from whatever numbers happen to be lying around.
Before training starts, pull baseline data from the systems that already track the metric you care about: your HRIS for turnover and tenure, your CRM for close rates and deal size, your quality assurance platform for call scoring, and your time-tracking system for handle time and shift adherence. Store all of it in one place, tagged by employee, team, and date, so the post-training pull can be matched cleanly against it.
- Track adoption metrics weekly for at least the first month: active practice sessions, assessment scores, and usage rates against expected frequency.
- Set a follow-up cadence, typically 30, 60, and 90 days post-training, rather than a single measurement at the end.
- Loop in finance early to agree on the hourly rate, contribution margin, and cost-per-incident figures before you calculate anything, not after.
- Document every assumption in writing, including who validated the attribution percentage and why.
| Data category | Source system | Who owns it |
|---|---|---|
| Baseline performance metric | CRM, QA platform, time system | Training or operations |
| Fully loaded cost inputs | Finance, HRIS | Finance partner |
| Adoption and usage data | Training platform dashboard | L&D or training manager |
| Attribution validation | Frontline managers | Operations manager |
Involve training, managers, finance, and operations from the start. A report that finance didn't help build is a report finance will pick apart.
Three Worked Examples: Onboarding, Turnover, and Errors
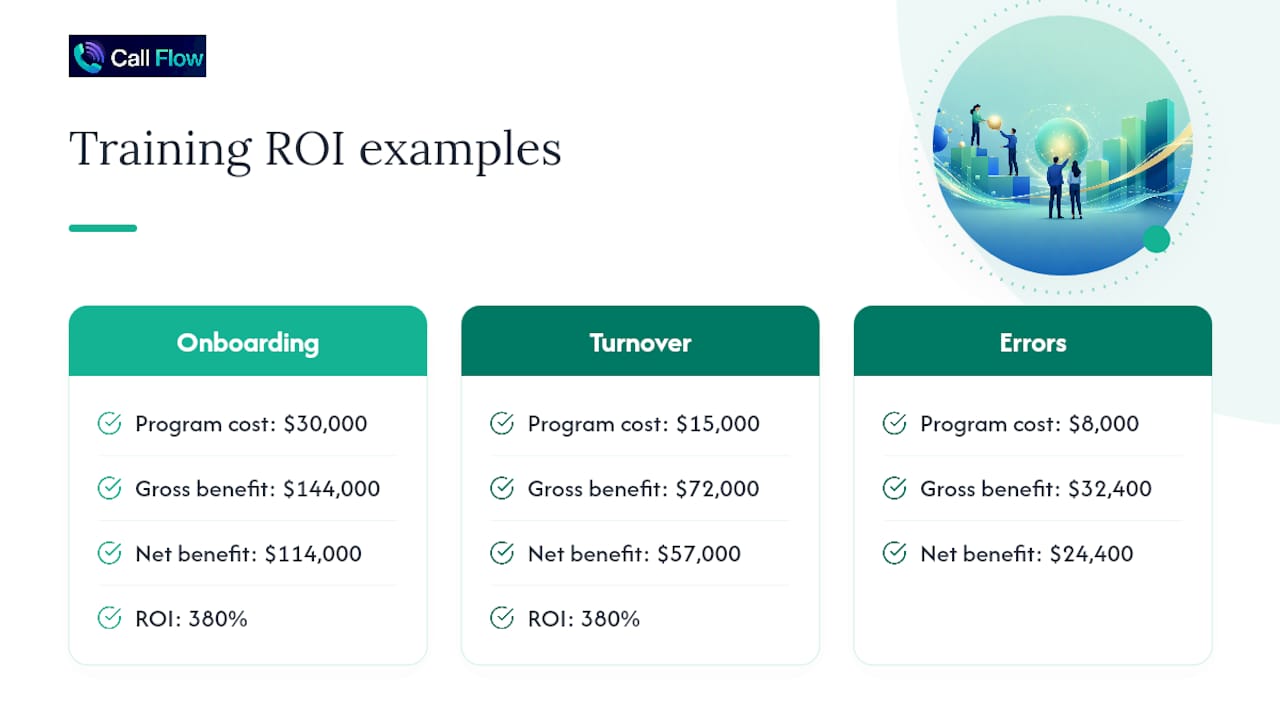
Onboarding ramp time. A team of 20 new reps previously took 90 days to hit full productivity; a new training program cuts that to 60 days. At a fully loaded cost of $40 per hour and 6 productive hours per day recovered across 30 days, that's $7,200 per rep, or $144,000 across the cohort. Program cost: $30,000. Net benefit: $114,000. ROI% = ($114,000 ÷ $30,000) × 100 = 380%. Payback period: under three weeks.
Turnover reduction. If avoided turnover saves $18,000 per departure prevented (recruiting, ramp loss, manager time) and the program plausibly prevents 4 departures a year, gross benefit is $72,000 against a $15,000 program cost. Net benefit: $57,000. ROI% = 380%.
Error reduction. A support team cuts escalation-worthy errors from 40 to 22 a month, at $150 per incident in rework and refunds. That's an $2,700 monthly saving, or $32,400 annualized, against an $8,000 program cost. Net benefit: $24,400.
What Would a Sales Call Flow Executive Report Look Like?
Simulated call practice with instant scoring generates the exact data ROI calculations need: usage rates, competency scores, and time-to-proficiency, all timestamped and tied to individual reps. Teams using Call Flow's role-play training approach have documented 147% faster ramp time and a 129% improvement in resolution rates, the kind of before-and-after figures that plug directly into the ramp-time and error-reduction formulas above.
An executive ROI report built from that data should include:
- ROI% and BCR, reported as a range with a most-likely estimate
- Net benefit and payback period in months
- Measurement window and baseline definition
- Attribution method used and the resulting attribution percentage
- Fully loaded cost breakdown by category
- Sensitivity range showing the best case, worst case, and most likely
- Any meaningful unmonetized outcome (morale, confidence, retention signal)
Pro Tip: A training metrics dashboard that tracks usage and score improvement in real time gives you a running realized-adoption rate instead of a one-time guess, which makes every ROI report after the first one faster to build and easier to defend.
How Should You Present Training ROI to Finance and Leadership?
Lead with the headline ROI number, then immediately name the one assumption that most affects it. Finance partners trust a report more when you volunteer its weak point before they find it themselves. If your attribution percentage is the softest number in the calculation, say so in the first paragraph, not buried in an appendix.
Stay conservative on purpose. Sensitivity ranges are not hedging, they're what separates a credible report from a slide that gets challenged in the first meeting.
Before scaling any program, run a short pilot with a pre-agreed measurement window and the report template above already filled out with placeholder assumptions. Agreeing on the method before you have the answer is the only way to keep the number honest.
— Costa
Turn Practice Sessions Into ROI Data Automatically
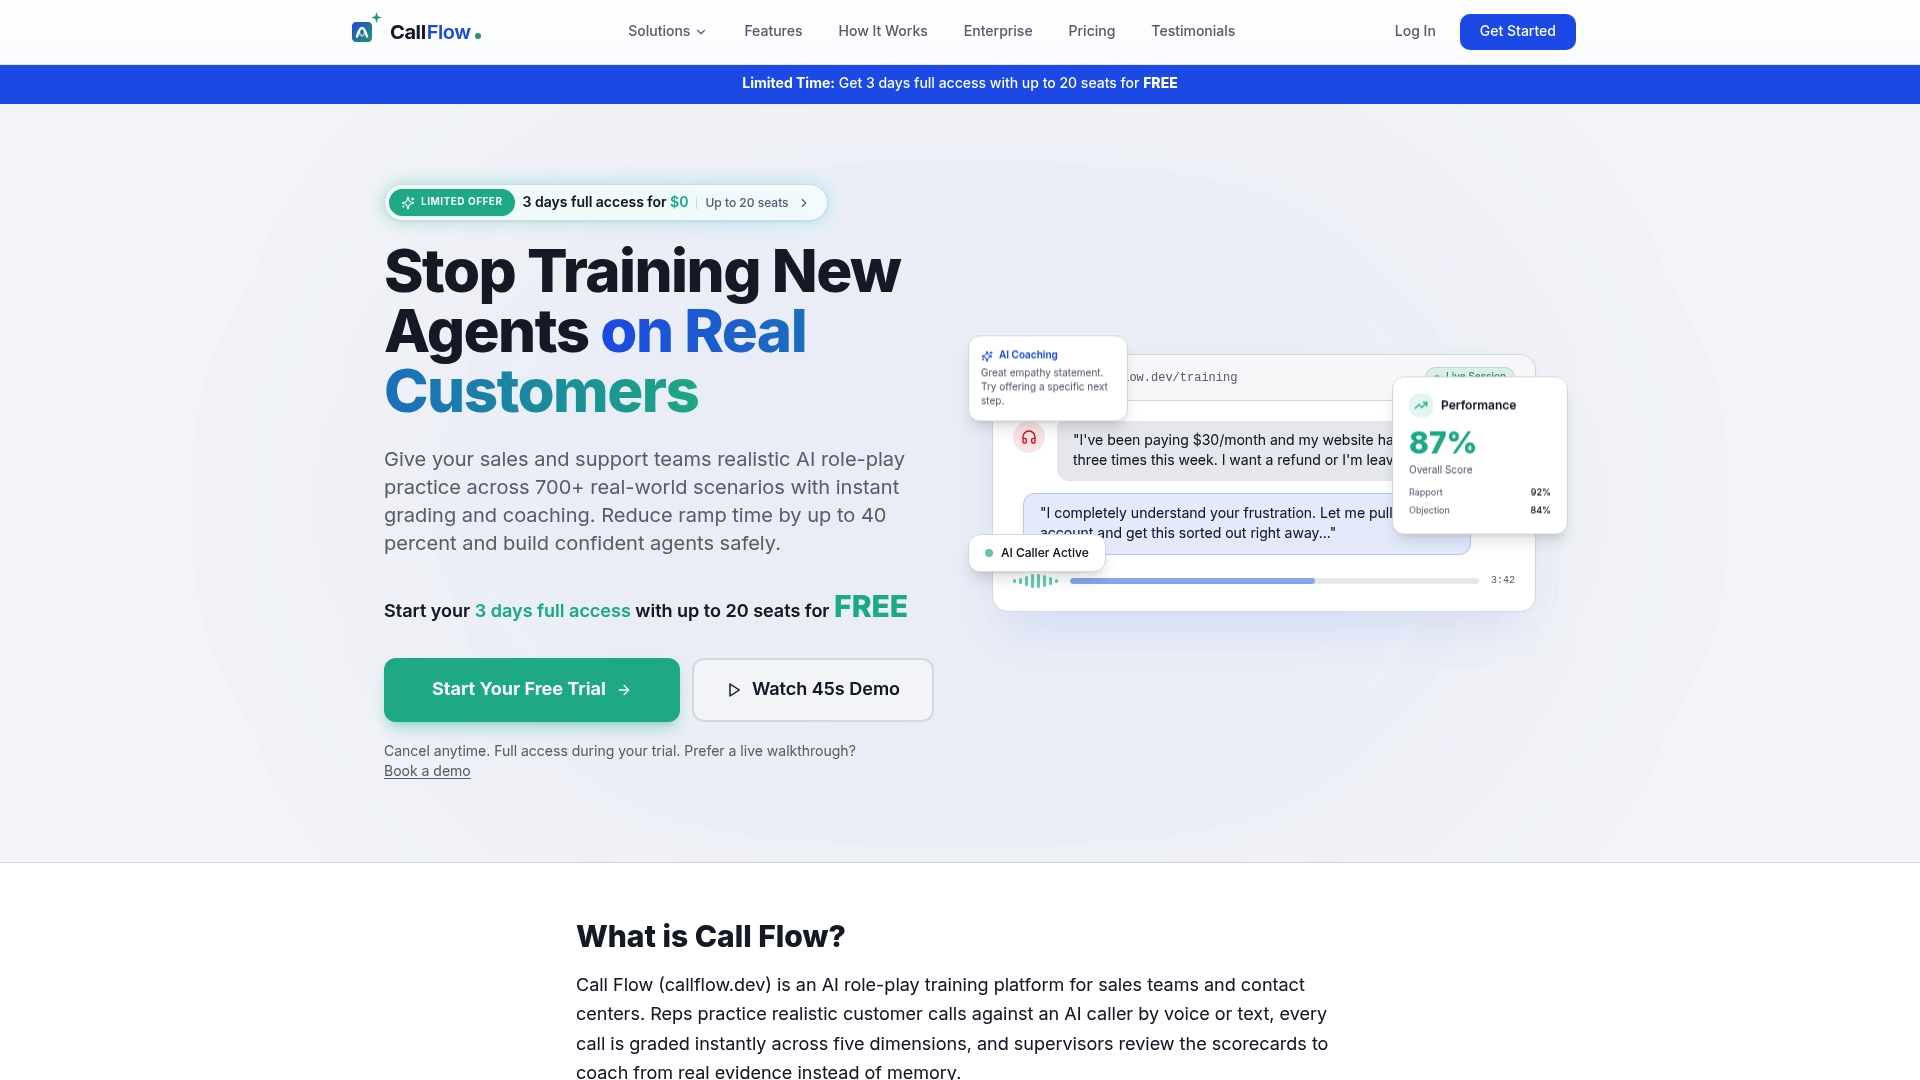
Every calculation in this article depends on clean adoption and performance data, and that's the part most training programs handle worst. Callflow generates that data as a byproduct of practice: every role-play session produces a score across five performance dimensions, a completion timestamp, and a supervisor-visible trend line, so the realized-adoption rate and time-to-proficiency numbers your ROI report needs are already sitting in a dashboard instead of a manager's memory.
Callflow's plans run from $7.42 a month on the Starter plan up through Scale, with custom Enterprise setups for larger contact centers that need deeper integration with existing QA and HRIS systems. Start a free trial, run one team through 60 days of scored practice, and you'll have real usage and competency data ready for your next ROI report before your next quarterly review.
Sources
- Why employee training pays companies twice — Harvard Business School Working Knowledge
- Measuring the ROI of Your Training Initiatives — SHRM
- A methodology for projecting the return on investment of training technologies — PMC/NCBI
This article is general information, not a substitute for advice from a qualified financial advisor. Consult a qualified financial professional about your own circumstances before acting on anything here.
FAQ
What Is a Good ROI for Training?
A result under 100% isn't necessarily a failure; it may reflect a program with genuine but smaller, harder-to-monetize benefits like compliance risk reduction.
How Do You Measure Training Effectiveness and ROI?
Training effectiveness is measured through the Kirkpatrick levels, reaction, learning, behavior change, and business results, while ROI specifically requires converting that Level 4 business result into dollars and comparing it to fully loaded program cost. The Phillips ROI methodology formalizes this by adding an isolation step before the dollar conversion.
How Do You Measure Coaching ROI?
Coaching ROI follows the same formula as training ROI calculation: monetize the performance change (faster ramp, higher close rate, fewer errors), subtract the fully loaded cost of the coaching program, then divide by that cost. Because coaching is often ongoing rather than a single event, most teams use a rolling 90-day window and re-baseline quarterly rather than measuring once and stopping.
What Costs Should Be Included in a Fully Loaded Training Cost?
Fully loaded costs include instructor or platform fees, materials and technology, and the wages of every participant for the hours spent training instead of working. Leaving out lost productivity time is the most common way training ROI gets overstated.
Can Call Flow Data Be Used Directly in an ROI Calculation?
Yes. Usage rates, scoring trends, and time-to-proficiency data from Callflow's dashboards map directly to the realized-adoption rate and ramp-time inputs used in the onboarding and error-reduction formulas covered above. Current pricing for all plans is listed on the Callflow pricing page.