

Use CES to find and fix friction. Use CSAT to measure the quality of an outcome. Run both where a workflow needs both signals, and treat neither as a substitute for NPS at the relationship level. Gartner-backed research shows 94% of low-effort customers intend to repurchase, versus just 4% of high-effort customers, which is why effort deserves its own dedicated score, not a footnote inside satisfaction.
TL;DR:
- Use CES to identify process friction immediately after effortful tasks, and keep the scale and timing consistent for accurate trending.
- CSAT measures outcome satisfaction but should be used after a realistic usage window, segmented by channel, and compared to its custom baseline.
- High customer effort (CES) predicts repurchase intent far more reliably than satisfaction scores alone, highlighting the importance of measuring both signals.
- When CSAT and CES conflict, focus on process improvements for high CSAT but low CES, and analyze open-text responses for quick insights.
- Benchmark scores against historical data and segment analyses, avoiding industry averages as rigid thresholds to detect genuine program shifts.
Table of Contents
- What Does CSAT Measure, and How Do You Calculate It?
- How Do You Measure CES, and What Does It Predict?
- CSAT vs CES: What Sets Them Apart?
- When Should You Use CSAT vs CES?
- How Do You Design Surveys for CSAT and CES?
- What Do You Do When CSAT and CES Disagree?
- What Do Good CSAT and CES Scores Look Like?
- How Do CSAT, CES, and NPS Fit Together?
- Does Better Training Actually Move CES and CSAT?
- What Should CX Leaders Do in the First 90 Days?
- Sources
What Does CSAT Measure, and How Do You Calculate It?
CSAT measures whether a specific interaction or outcome met expectations. You ask it right after a defined moment: a support ticket closes, an order arrives, a product gets used for the first time. The question is almost always some version of "How satisfied were you with [X]?" and the response options run on a scale, most commonly 1 to 5, from "very dissatisfied" to "very satisfied."
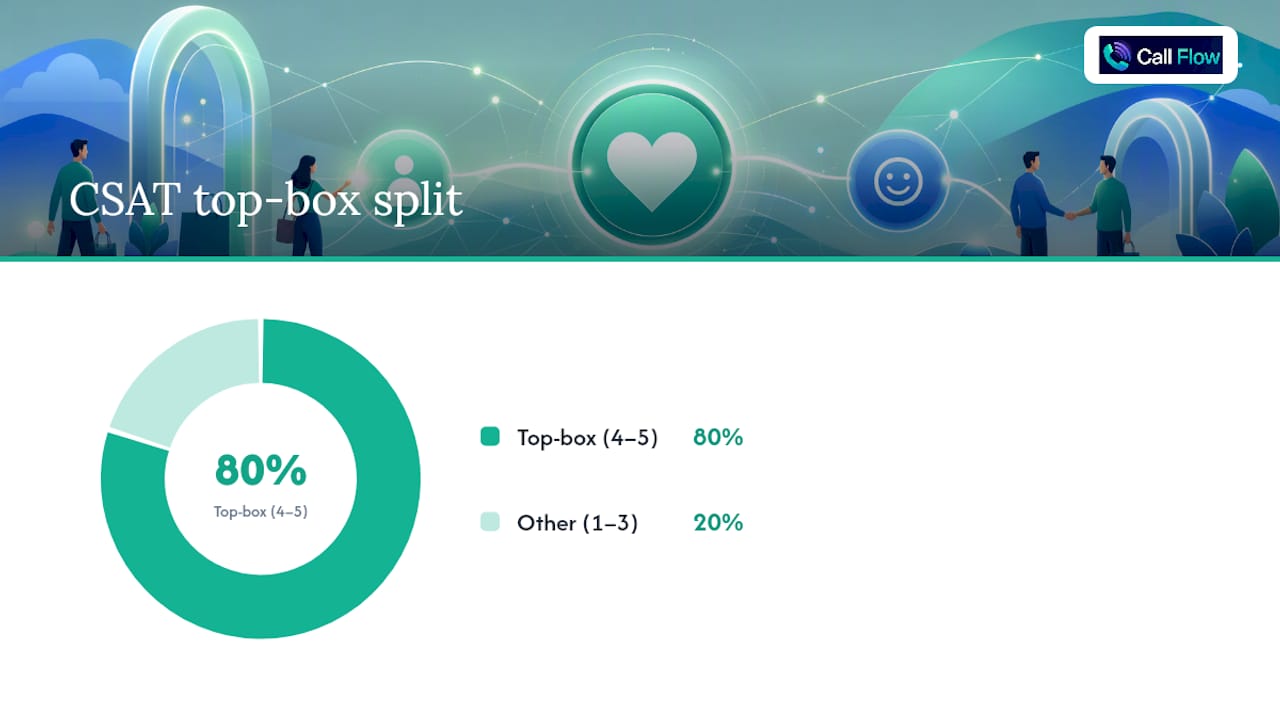
Calculation is where most teams get sloppy. CSAT is reported as a top-box or top-two-box percentage, not a raw average. If 400 out of 500 respondents pick a 4 or 5 on a 5-point scale, your CSAT is 80%. That's a different math discipline than CES, which reports a mean rather than a percentage, and mixing the two on one chart without labels invites bad decisions.
A few operational notes matter more than the scale itself:
- Segment CSAT by channel (chat, phone, email) and by product line. A blended score hides which team actually needs attention.
- Wait for a real usage window before asking about a product, not just delivery. Someone can't rate a product they haven't opened yet.
- Keep the wording identical across survey waves. Small phrasing changes shift results enough to break trend lines.
- Report CSAT against its own historical baseline, since industry comparisons vary too widely to be a fair yardstick on their own.
None of this is complicated. It just requires a fixed process and someone accountable for keeping it consistent quarter over quarter.
How Do You Measure CES, and What Does It Predict?
CES traces back to a CEB study that Gartner has since carried forward, and it asks one narrow question: how much effort did this task take? The original version used a direct effort scale ("How much effort did you personally have to put forth to handle your request?"). The newer CES 2.0 phrasing flips it into an agreement statement: "The company made it easy for me to handle my issue," with responses from "strongly disagree" to "strongly agree."
Scales typically run 1 to 7 or 1 to 5, and CES is reported as a mean score, not a percentage. That distinction trips up more dashboards than it should. A CES of 5.8 on a 7-point scale where 7 means "easy" tells a very different story than a 5.8 where 7 means "hard." Direction has to stay fixed across every survey wave and every team pulling the number.
Timing is non-negotiable with CES. Send it immediately after the effortful task, not the next day and never at the end of the week. Effort perception fades fast, and a delayed survey measures memory, not experience.
Practical rules for running CES well:
- Trigger the survey within minutes of task completion, not on a weekly batch.
- Use agree/disagree phrasing if you want alignment with the CEB/Gartner original; use direct effort wording if your team prefers plainer language.
- Never invert the scale mid-program, and label the direction clearly in every report.
Pro Tip: Put the scale direction in the chart title itself, e.g. "CES (7 = Very Easy)." It sounds redundant until a new analyst reads the dashboard cold and draws the opposite conclusion from what the data actually shows.
CSAT vs CES: What Sets Them Apart?
The core difference isn't cosmetic, it's what each score is built to catch. CSAT measures whether an outcome was good. CES measures whether getting there was hard. A customer can rate a resolved support ticket 5 out of 5 on satisfaction while still telling you it took three transfers and two days to get there, and that gap is exactly the kind of blind spot CES exists to close.
| Dimension | CSAT | CES |
|---|---|---|
| What it captures | Outcome quality | Process friction |
| Typical timing | Post-delivery, post-resolution | Immediately after an effortful task |
| Reporting unit | Top-box percentage | Mean score |
| Best predicts | Immediate satisfaction with a moment | Repurchase intent and loyalty |
The predictive gap is the real headline here. Gartner's research, cited by SurveyMonkey, found that 94% of customers who reported low effort said they intended to repurchase, compared to only 4% of those who reported high effort. CSAT doesn't carry that kind of forecasting power on its own. A customer can be satisfied with a single transaction and still churn months later because the process around every transaction wore them down. HBR's research on this exact tension argues that companies chasing "delight" scores often miss the friction that's actually driving attrition.
For retention-focused teams, that means CES belongs earlier in the diagnostic chain than CSAT. CSAT tells you whether a moment went well. CES tells you whether your customer will bother coming back for the next one.
When Should You Use CSAT vs CES?
Match the metric to the question you're actually trying to answer, not the touchpoint's convenience.
- Onboarding steps. Use CES. New customers are learning your process, and friction here predicts early churn better than satisfaction does.
- Support resolution. Use CES right after the ticket closes to catch effort spikes, then CSAT a bit later once the customer has lived with the fix.
- Checkout and payment flows. Use CES. A purchase is a task with a clear start and end point, exactly what effort scoring is built for.
- Returns and self-service workflows. Use CES. These are friction-prone by design, and small process fixes here move the score fast.
- Post-purchase quality checks. Use CSAT. The task is done; now you're asking whether the product or delivery met expectations.
- Agent performance reviews. Use CSAT. You're evaluating outcome quality on a specific interaction, not the mechanics of the process.
The simplest filter, when you're unsure which to run: ask yourself if the touchpoint is about getting through a process or judging a result. Process friction points get CES. Outcome and quality moments get CSAT. If a touchpoint genuinely has both, that's your signal to run one immediately after the task (CES) and the other after a short delay (CSAT), rather than trying to force one survey to answer two different questions.
How Do You Design Surveys for CSAT and CES?
Question wording decides half your data quality before a single response comes in. For CES, agree/disagree phrasing ("It was easy to resolve my issue") tends to read more naturally in a self-serve email, while direct effort phrasing ("How much effort did you personally have to put forth?") gives you a sharper signal in phone or chat follow-ups where the agent can explain the scale verbally. For CSAT, keep the question anchored to the specific moment, not the whole relationship: "How satisfied are you with today's resolution?" beats "How satisfied are you with our company?" every time.
Scale direction is the single most common failure point. Some CES implementations run 1 as "easy" and 7 as "hard," while others reverse it, and if two teams in the same company use opposite conventions, your quarterly comparisons become meaningless. Pick one direction, document it in the survey tool itself, and never let a new survey template ship with the default flipped.
A few more hygiene rules worth locking into your process:
- Send CES within minutes of task completion; send CSAT after a realistic usage or delivery window.
- Add exactly one open-text follow-up ("What made this easy or hard?") rather than stacking three.
- Flag low response-rate segments before trusting a score swing. A 12% response rate on 40 tickets is noise, not a trend.
- Label every dashboard chart with its unit. Mean and percentage should never share an axis without a caption explaining which is which.
Pro Tip: Run a quarterly audit where someone outside the CX team reads your dashboard cold and tells you what they think each number means. If they misread a CES mean as a percentage, your labeling has already failed a real customer of that data.
Teams building this into their contact-center workflows often start with a structured CSAT program before layering CES on top, since the reporting discipline transfers cleanly between the two.
What Do You Do When CSAT and CES Disagree?
Conflicting scores aren't a data error, they're a diagnosis waiting to happen.
- High CSAT, poor CES. The outcome satisfied the customer, but getting there was a slog. Look at process steps: hold times, transfers, form length. Fix the path, not the outcome.
- Good CES, low CSAT. The process was smooth, but the result disappointed. This usually points to a product or policy gap, not an operational one. Review the offer, not the workflow.
- Both weak. You have a systemic problem. Prioritize the friction fix first since it's usually cheaper and faster than a product change, then reassess CSAT.
- Both strong, but churn persists. Neither transactional metric is catching the real driver. Bring NPS or a cohort-level retention view back into the picture temporarily.
In every one of these patterns, the open-text response is your fastest path to a real answer. A single follow-up question ("What made this easy or hard?") usually explains the gap faster than another quarter of quantitative tracking. Route the findings straight into targeted coaching workflows rather than letting them sit in a report nobody actions.
What Do Good CSAT and CES Scores Look Like?
Benchmarks are directional, not universal, and treating them as pass/fail thresholds is where most programs go wrong.
The ACSI's national customer satisfaction average tends to sit in the mid-70s, but sector variance is wide. A subscription software company and a utility provider live under very different structural pressures, and both can be "healthy" at different absolute scores. CES benchmarks vary similarly by scale and industry, so a mean of 5.5 on a 7-point scale means little without knowing your own program's history.
A few rules keep target-setting honest:
- Compare each metric to its own trailing baseline, not to a competitor's published number.
- Set targets by segment and channel, since a blended average can mask a struggling subgroup.
- Require a minimum sample size before reacting to a score swing. A jump from 78% to 82% CSAT on 30 responses is statistical noise, not a trend worth a team meeting.
- Watch direction of movement over two or three cycles before declaring a change real.
The goal isn't hitting an arbitrary industry number. It's catching a genuine shift before it shows up in churn.
How Do CSAT, CES, and NPS Fit Together?
Each metric earns a different cadence and a different owner. CES runs immediately after effort-heavy tasks like onboarding, checkout, and support resolution. CSAT runs after delivery or resolution, once the customer has had a moment to judge the outcome. NPS runs quarterly or by cohort, since it measures the relationship, not a single moment. CustomerGauge's research on B2B programs shows many companies anchor on NPS first, then layer CSAT and CES in for operational precision.
Dashboards need firm rules here. Never plot a CES mean and a CSAT percentage on the same axis without separate labels, and always correlate both against retention or revenue data rather than treating them as standalone health scores.
Ownership matters as much as cadence:
- Frontline ops and support leads should own CES, since they control the process steps that drive it.
- Product and quality teams should own CSAT, since it reflects outcomes they design.
- CX or leadership should own NPS, since it reflects the cumulative relationship across every touchpoint above.
Feed both transactional scores into coaching dashboards so a CES dip on a specific workflow routes directly to the training queue instead of sitting in a static report.
Does Better Training Actually Move CES and CSAT?
Process fixes only go so far when the real friction is an underprepared agent fumbling a call. AI role-play training platforms give agents repeated practice on scenarios driving high-effort contacts, with instant grading across multiple performance dimensions so managers see where effort creeps in before a customer ever complains. Teams using this kind of targeted practice have seen 147% faster ramp time and a 129% improvement in resolution rates, both of which move CES and CSAT in the same direction at once, since a confident agent resolves faster and leaves the customer with less friction to report.
A rep who's rehearsed the tricky renewal conversation twenty times in simulation doesn't need three call transfers to get it right on a live line. That's fewer touches, lower effort, and a better outcome, scored twice, in two different metrics, for the same underlying fix.
Pairing this kind of training with structured sales practice gives newer reps a faster path to the confidence that shows up directly in effort scores.
What Should CX Leaders Do in the First 90 Days?
Start narrow. Pick your three highest-friction workflows, likely onboarding, support resolution, and checkout, and run CES immediately after each. Layer CSAT onto your delivery or resolution touchpoints a few days later. Add exactly one open-text question to each survey, nothing more, and compare results before and after any process change you make.
Governance is where most programs quietly fail. Assign a named owner to each metric, set a minimum sample-size threshold before anyone reacts to a swing, and build a lightweight change-ticket process so a friction spike routes straight into an ops fix instead of a slide deck. The loop that actually works ties measurement to training: when CES dips on a specific workflow, that workflow becomes the next role-play scenario your team practices, not just a line item in next quarter's report.
— Costa
Sources
- CES vs CSAT: Key Differences, Uses, Strategy & Guide — SurveyMonkey
- Stop trying to delight your customers — Harvard Business Review
- NPS vs CES vs CSAT — CustomerGauge