

An agent performance dashboard gives supervisors one screen that flags SLA risk before it breaks, shows which agents are overloaded, and points to specific coaching topics worth a conversation. The best ones pair volume metrics like handle time with quality signals like CSAT, so speed alone never wins the day. Tools like Call Flow feed graded coaching data straight into that same view.
TL;DR:
- Supervisors should focus on pairing volume metrics with quality signals like CSAT and resolution rate to prevent a rush to speed or quantity alone.
- Real-time exception flags must be based on stable paired metrics and used to trigger diagnostic and corrective actions, not just alerts.
- Combining operational data with transcript excerpts and graded practice scores enhances coaching impact and helps address root causes effectively.
- Data feeds should include agent ID, timestamped status, interaction times, CSAT responses, and queue details to ensure reliable, normalized metrics.
- Ordinary dashboards work best when built around detection of issues via exceptions, followed by diagnosis and targeted action, rather than simply monitoring agent rankings.
Table of Contents
- What an Agent Performance Dashboard Actually Shows
- Layouts That Actually Get Used
- Turning a Red Card Into an Action
- The Systems Your Dashboard Needs to Talk To
- Why Every Metric Needs a Partner
- Closing the Loop With Training Data
- The Playbook Most Teams Get Backward
- Sources
What an Agent Performance Dashboard Actually Shows
A dashboard built for supervisors needs a short list of unambiguous metrics, not a wall of numbers. Average handle time (AHT) counts active handle minutes only, separate from queue wait or after-call work. Occupancy measures the share of logged-in time an agent spends actively working. SLA adherence tracks the percentage of interactions resolved inside a target window. CSAT, resolution rate, and reopen rate round out the quality side.
Each metric needs a job description supervisors can defend in a coaching meeting:
- Interaction volume: how many calls, chats, or tickets an agent closed in the period
- Agent status: live state (available, on call, break, offline) pulled from ACD or telephony logs
- Resolution rate: percent of interactions closed without escalation, distinct from handle time
- Reopen rate: percent of "resolved" tickets a customer reopened within a set window
- SLA adherence: percent of interactions meeting the agreed response or resolution target
Refresh cadence matters as much as the metric itself. Status and queue depth belong on a real-time feed. AHT and CSAT trends work fine on an intraday refresh, and reopen rate or coaching summaries are usually a daily rollup.
Layouts That Actually Get Used
Supervisors don't need a data warehouse view. They need three zones on one screen: team totals up top, per-agent rows in the middle, and an exceptions column that screams when something needs attention now.
- Team KPI strip (top left): total volume, average SLA adherence, and occupancy for the shift.
- Per-agent paired rows: each agent gets a volume metric next to a quality metric, never alone. Handled by Agent sits beside CSAT by Agent; Avg Handle Time by Agent sits beside Resolution Rate.
- Backlog table: open tickets per agent, sorted by backlog age, so aging work surfaces before it breaches SLA.
- Exceptions column: real-time flags for agents outside normal range on any paired metric.
Filter by team, shift, and channel at minimum, and add a complexity bucket if your ticket system tags severity. A voice queue and a Tier 2 email queue should never sit on the same unfiltered leaderboard.
Pro Tip: Build the exceptions column last, after your paired metrics are stable. An alert system built on noisy baseline data just trains supervisors to ignore it.
Turning a Red Card Into an Action
A flashing tile is worthless without a next step. Run the same three moves every time: detect, diagnose, act.
- Detect: the dashboard flags a metric outside normal range, real time for status/queue issues, intraday for trend issues.
- Diagnose: drill into the agent-level card. Is CSAT low alongside a high reopen rate? That points to a resolution-quality gap, not a speed problem.
- Act: rebalance the queue, assign a graded practice scenario, or escalate to a team lead.
Say an agent shows low CSAT paired with a high reopen rate for two straight days. That combination usually means the agent is closing tickets to hit a handle-time target rather than actually solving the problem. Pull a transcript excerpt, pair it with a graded role-play assignment targeting that exact scenario type, and review the grade trend the following week.
On the staffing side, rising occupancy alongside a growing backlog age is your surge signal. Reassign agents from a lighter queue before SLA adherence drops, not after.
Pro Tip: Never walk into a coaching conversation with a metric alone. Bring the data snapshot, a transcript excerpt, and (if available) a graded practice score. The combination is far harder to argue with than a number on a screen.
The Systems Your Dashboard Needs to Talk To
A dashboard is only as reliable as the systems feeding it. You need telephony or CDR data for call timing, ACD/OM data for status history, a helpdesk or ticketing system for resolution flags, chat transcripts where applicable, CSAT survey results, and WFM schedules for normalization.
Ask BI or your vendor for these exact fields, by name:
- Agent ID, tied consistently across every source system
- Timestamped status history (available, on call, break) at the second, not the minute
- Interaction start and end times, plus a resolution flag
- CSAT response linked to the specific interaction ID, not just the agent
- Channel, queue, and scheduled hours per shift
The Metabase build guidance recommends joining a tickets table (assignee, resolved timestamp) with an agents table and CSAT ratings keyed to the ticket ID, exactly the join structure that avoids double-counting when one interaction spans multiple status changes. Native connectors for platforms like Zendesk, Genesys, or Google CCAI cut this integration work down considerably, since they already expose these fields in a documented schema instead of a raw export you have to reverse-engineer.
Why Every Metric Needs a Partner
The single most common dashboard mistake is showing volume alone. A raw call-count leaderboard rewards the agent who rushes, not the one who solves problems, which is why best practice pairs every efficiency metric with a quality metric: AHT next to CSAT, ticket volume next to reopen rate.
Normalization matters just as much as pairing. Compare agents per 100 scheduled hours, not raw totals, so a part-time agent doesn't look artificially weak next to a full-timer. For handle time specifically, use the median rather than the mean since a handful of complex calls will skew an average badly.
- Pair volume with a quality counterpart on every single card
- Normalize by scheduled hours before ranking anyone
- Filter by complexity bucket when your ticket types vary widely
- Skip public shaming leaderboards; keep comparative views supervisor-facing only
- Add a footnote with the metric definition and a refresh timestamp on every tile
Automated scoring approaches, including LLM-as-a-judge evaluation, increasingly combine deterministic checks with human review to calibrate agent scoring before it ever reaches a dashboard tile, which matters if you're layering AI-graded metrics on top of traditional ones.
Closing the Loop With Training Data
A dashboard tells you something is wrong. Training data tells you what to do about it. When role-play grading breaks a skill gap into specific dimensions, tone, objection handling, closing technique, that same grade trend belongs right next to the operational metrics it's meant to fix.
Practical additions worth building into an existing supervisor view:
- A practice completion card showing which agents finished assigned scenarios this week
- An average grade by skill card, so a drop in "de-escalation" scoring flags before CSAT drops too
- A grade trend over time line, run alongside CSAT and resolution rate for the same agent
Pairing a scenario like handling an escalated data-loss complaint with the agent's live reopen-rate trend turns an abstract skill gap into a specific, assignable fix.
The Playbook Most Teams Get Backward
Most supervisors build dashboards to watch agents. The better use is building dashboards to catch problems before agents ever have to explain them. That distinction changes what you build first: not a leaderboard, but an exceptions column tied to paired metrics you'd defend in a one-on-one.
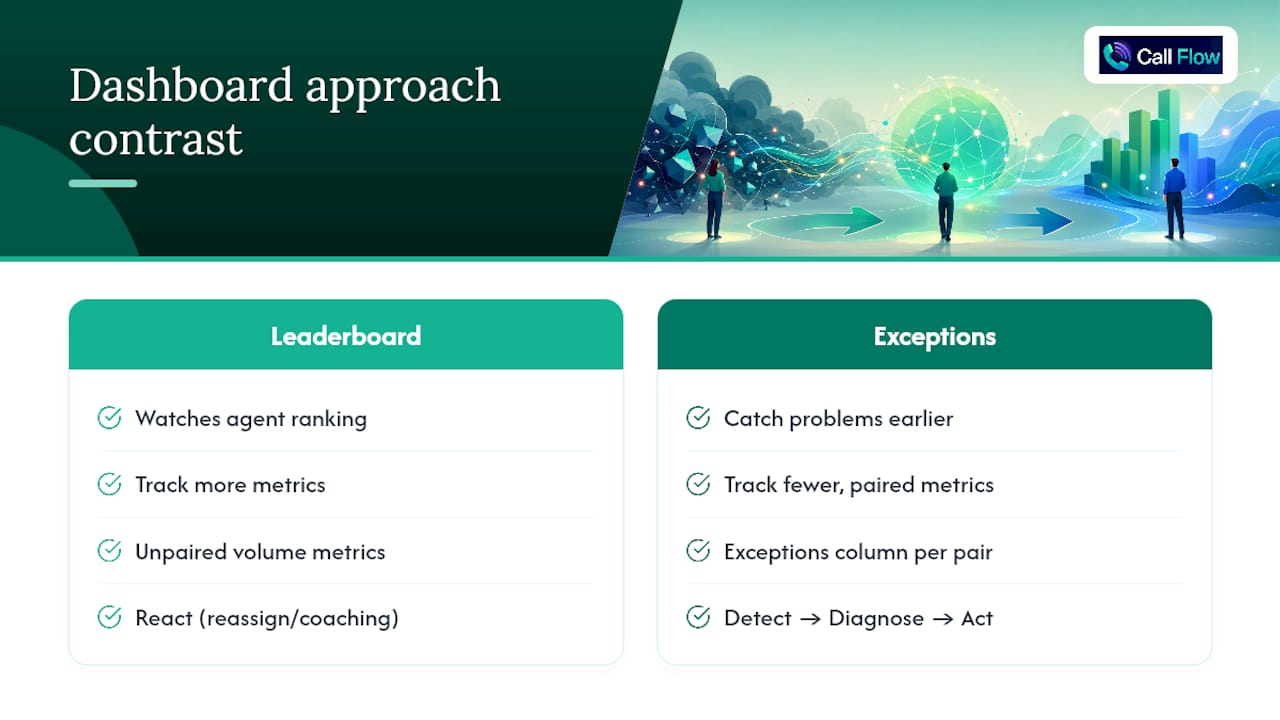
The conventional advice, "track more metrics", is backward. Track fewer metrics, but pair every one you keep. A single unpaired volume number invites the wrong behavior almost immediately; agents optimize for whatever gets watched, so if handle time stands alone, it drops, and quality quietly follows it down.
What the research actually supports is a three-step discipline: detect through the dashboard, diagnose through a drilldown, act through coaching or rebalancing, in that order, every time. Skipping the diagnose step is the single most common failure I see in how teams use these tools. They see a red tile and reassign work or start a coaching conversation without ever checking whether the root cause is agent skill, queue routing, or ticket complexity.
Prioritize the pairing rule and the diagnose step before you prioritize more integrations or fancier visualizations. A simple dashboard used correctly beats a sophisticated one used as a scoreboard.
— Costa
Sources
- Agent Performance Dashboard - Genesys Documentation
- Support Agent Performance Dashboard in Metabase (Template & Cards)