

Time to proficiency is the number of days between an employee's defined start point and the moment they hit a measurable performance bar. Pick one decision before anything else: define an objective stop event, not a gut feeling. Two frameworks give this immediate structure.
- 70-20-10 rule: proficiency comes mostly from doing the job (70%), talking to peers (20%), and formal training (10%).
- KPI Depot's standard: a defined stop event, like a sustained quality score or a set number of independent interactions, replaces guesswork with a timestamp.
Key Takeaways
Time to proficiency shortens fastest when teams pair an instrumented, observable stop event with high-fidelity practice, spaced reinforcement, and consistent manager coaching.
| Point | Details |
|---|---|
| Define one stop event | Freeze a single observable milestone, like a sustained quality score, before comparing any cohorts. |
| Separate productivity from proficiency | Track first output and sustained quality bar as two different dates, not one. |
| Join your data sources | Pull start dates, training completion, and performance signals from HRIS, LMS, and CRM systems automatically. |
| Include leavers in reporting | Report ramp time for both those who reached proficiency and those who left first to avoid survivorship bias. |
| Pilot practice-based tools first | Platforms like Callflow let teams instrument stop events directly through AI-graded role-play practice. |
Table of Contents
- What Is Time to Proficiency vs. Time to Productivity?
- Why Ramp Time Affects Retention and Revenue
- How Do You Measure Time to Proficiency?
- What Usually Slows Down Ramp Time?
- What Actually Shortens Time to Proficiency?
- Where Does Time-to-Proficiency Data Go Wrong?
- A Real-World Look at Ramp-Time Reduction
- Why Most Ramp-Time Programs Fail Before They Start
- Piloting Callflow to Cut Your Own Ramp Time
- Frequently Asked Questions
- Sources
What Is Time to Proficiency vs. Time to Productivity?
Time to proficiency and time to productivity get used interchangeably, and that's a mistake. Time to productivity marks the day someone starts contributing output, even shaky output. Time to proficiency marks the day their output meets a defined quality bar consistently.
A new sales rep might book their first closed deal in week three (productive) but not hit the team's average deal size until week fourteen (proficient). That gap is the whole point of tracking both.
- Time to productivity: first meaningful output, however imperfect.
- Time to proficiency: sustained output at an operational standard.
- Learning curve: the shape of improvement between those two points.
Learning curves also get misread. A "steep learning curve" sounds hard, but in performance terms, steep means fast improvement. Slow, flat curves are the actual problem.
Why Ramp Time Affects Retention and Revenue
Every extra week of ramp time shows up somewhere on the balance sheet. Shorten the curve and you typically see movement in customer satisfaction scores, error rates, and revenue per rep within the same reporting cycle, because those metrics all trace back to the same underlying skill gap.
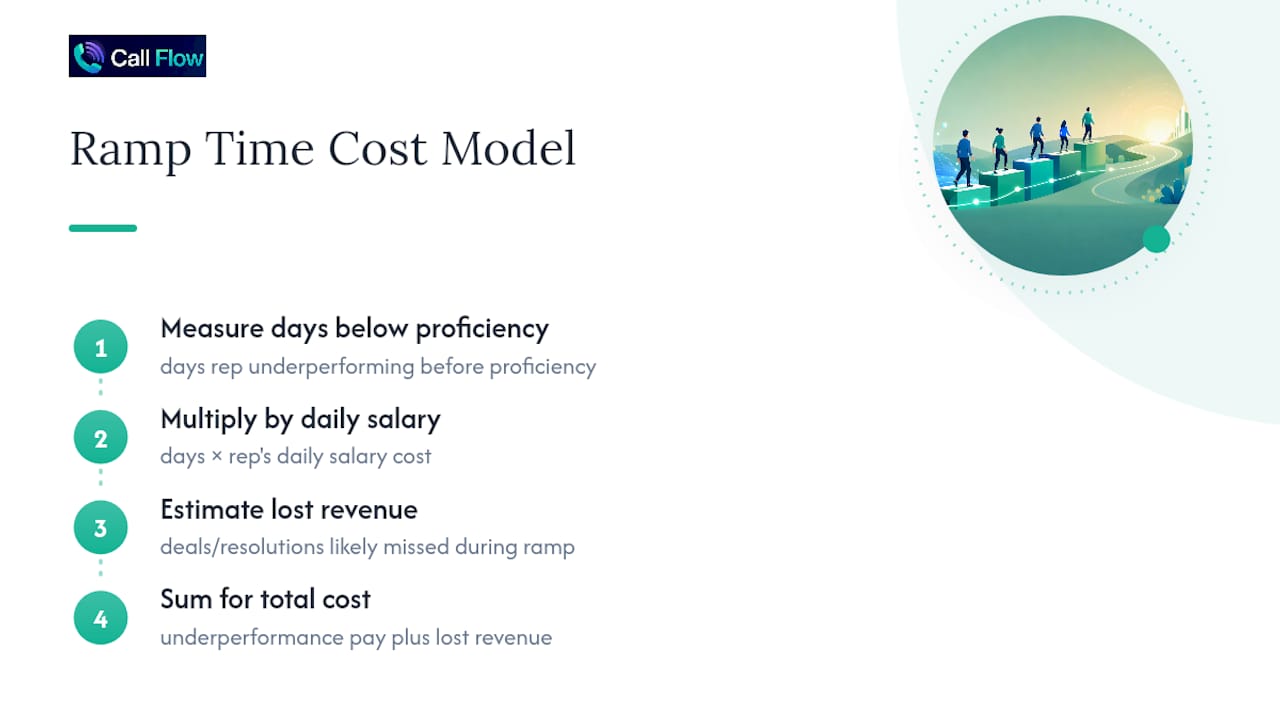
A rough cost model helps make the case to finance: multiply the days a rep spends below proficiency by their daily salary cost, then add the value of deals or resolutions they likely missed during that window. A rep who takes longer to reach quota performance costs the company a substantial period of underperformance, at full salary, on top of whatever revenue that seat should have produced.
Employee experience matters just as much. Reps who feel unprepared during their first months are far more likely to leave before their first review, which resets the ramp clock for their replacement and compounds the original cost.
How Do You Measure Time to Proficiency?
Measurement starts with two decisions: when the clock starts, and what stops it.
- Pick a clock start. Hire date answers "how long does onboarding really take?" Role start date (after transfers or promotions) answers "how long does this specific job take to learn?" Post-training completion date answers "how effective was the training itself?" Each answers a different question, so name yours explicitly in every report.
- Define an instrumented stop event. Good options include a quality score sustained for three consecutive weeks, a set number of independent customer interactions handled without escalation, or hitting a revenue baseline tied to quota. KPI Depot recommends freezing this definition before you start comparing cohorts, since a moving target makes trend data worthless.
- Apply the formula. Time to proficiency equals stop event date minus clock start date, averaged across a cohort. Exclude anyone who left before reaching the stop event from the average, but track them separately, because dropping them silently hides your real attrition cost.
- Join your data sources. Pull start dates from HRIS, training completion from your LMS, and performance signals from CRM or quality assurance tools. Manual spreadsheet stitching is where most of these programs break down.
- Set a reporting cadence. Report at 90, 120, and 180 days depending on role complexity, so you catch both fast-ramping roles and longer, technical ones.
Pro Tip: Build the stop event into your existing QA dashboard instead of creating a separate tracking sheet. If supervisors already see it during normal reviews, the data stays current without extra admin work.
What Usually Slows Down Ramp Time?
Most delayed ramp times trace back to a handful of repeat offenders, and they rarely show up alone.
- Role ambiguity. New hires who don't know what "good" looks like default to guessing, and guessing takes longer than following a standard.
- Fragmented knowledge access. If answers live in six different tools, reps waste hours hunting instead of practicing.
- Misaligned training sequences. Training that front-loads compliance content before job-specific skills pushes real skill-building later than it needs to happen.
- Inconsistent manager coaching. Two reps hired the same week can ramp at very different speeds purely because one manager coaches weekly and another coaches never.
- Operational complexity paired with low engagement. Complex products demand more repetition, and disengaged learners get less out of every repetition they do.
Any one of these adds days. Stacked together, they're usually why "average" ramp time numbers look worse than any single team's numbers should.
What Actually Shortens Time to Proficiency?
Not every intervention deserves equal investment. Pilot these roughly in this order, since each builds on data the previous one generates.
- High-fidelity practice scenarios. Realistic role-play, closely mirroring actual calls or customer conversations, does more to build proficiency than any other single lever, which lines up with the 70% weighting on experiential learning in the 70-20-10 model.
- Personalized microlearning with spaced reinforcement. Short refreshers spread over weeks beat one long training session for retention, and they're cheap to automate.
- Structured manager coaching with calibration. Give managers a shared rubric so coaching quality doesn't depend on which manager a rep happens to get.
- In-flow performance support. A searchable knowledge base, call scripts, and just-in-time prompts inside the tools reps already use cut the time spent searching for answers instead of applying them. Axonify's frontline research links this combination of adaptive learning and in-the-moment support to measurable ramp reductions.
For technical or highly regulated roles, pairing these tactics with a structured onboarding framework built for compliance-heavy hiring keeps ramp time honest even as documentation requirements pile up.
Pro Tip: Run any new intervention against a matched control group of at least 15 to 20 reps per cohort for one full ramp cycle before declaring a win. Smaller samples produce numbers that look great and mean nothing.
Where Does Time-to-Proficiency Data Go Wrong?
The metric is only as trustworthy as the data feeding it, and three mistakes account for most of the damage.
- Survivorship bias. Counting only reps who reached proficiency, and quietly dropping everyone who quit first, makes ramp time look faster than it is. Track leavers separately and report both numbers.
- Manual "proficient" flags. A manager's subjective judgment call drifts over time and across teams. Observable, timestamped events don't.
- Unstandardized start anchors. If one team uses hire date and another uses training completion date, your company-wide average is comparing two different measurements pretending to be one.
KPI Depot's guidance is to segment by role, cohort, and training track before drawing conclusions. A blended average across a sales floor with three very different product lines will mislead more than it informs. Keep cohort sizes above roughly 15 reps before trusting a trend as stable.
A Real-World Look at Ramp-Time Reduction
Publisher data from Callflow's own rollout, an AI role-play training platform that grades practice calls instantly across five performance dimensions, gives a concrete look at what instrumented practice can do to a ramp curve.
Teams using structured, AI-graded role-play practice as part of onboarding reported ramp times cutting close to half compared to their prior baseline, alongside a meaningful lift in first-call resolution. These are vendor-reported figures, and any team adopting a similar approach should replicate the measurement independently before reporting it internally.
To replicate this kind of result, instrument these before you start:
- A frozen stop event definition (quality score or independent interaction count)
- A control cohort using existing onboarding
- A pilot cohort of 15 to 20 reps running the new practice tool for one full ramp window
Why Most Ramp-Time Programs Fail Before They Start
The programs that stall aren't the ones with bad interventions. They're the ones that skip the boring governance step: agreeing on a stop event before piloting anything. Get an operations lead and a frontline manager to sign off on that one definition first. Everything else, the tools, the coaching cadence, the microlearning schedule, works better once that anchor is fixed. Start with one team, one narrow pilot, and one observable stop event you can point to without an argument.

Piloting Callflow to Cut Your Own Ramp Time
Callflow gives teams a way to instrument the exact stop events this article walks through, using AI-graded role-play scenarios that mimic real customer calls and score performance across five dimensions the moment a rep finishes practicing.
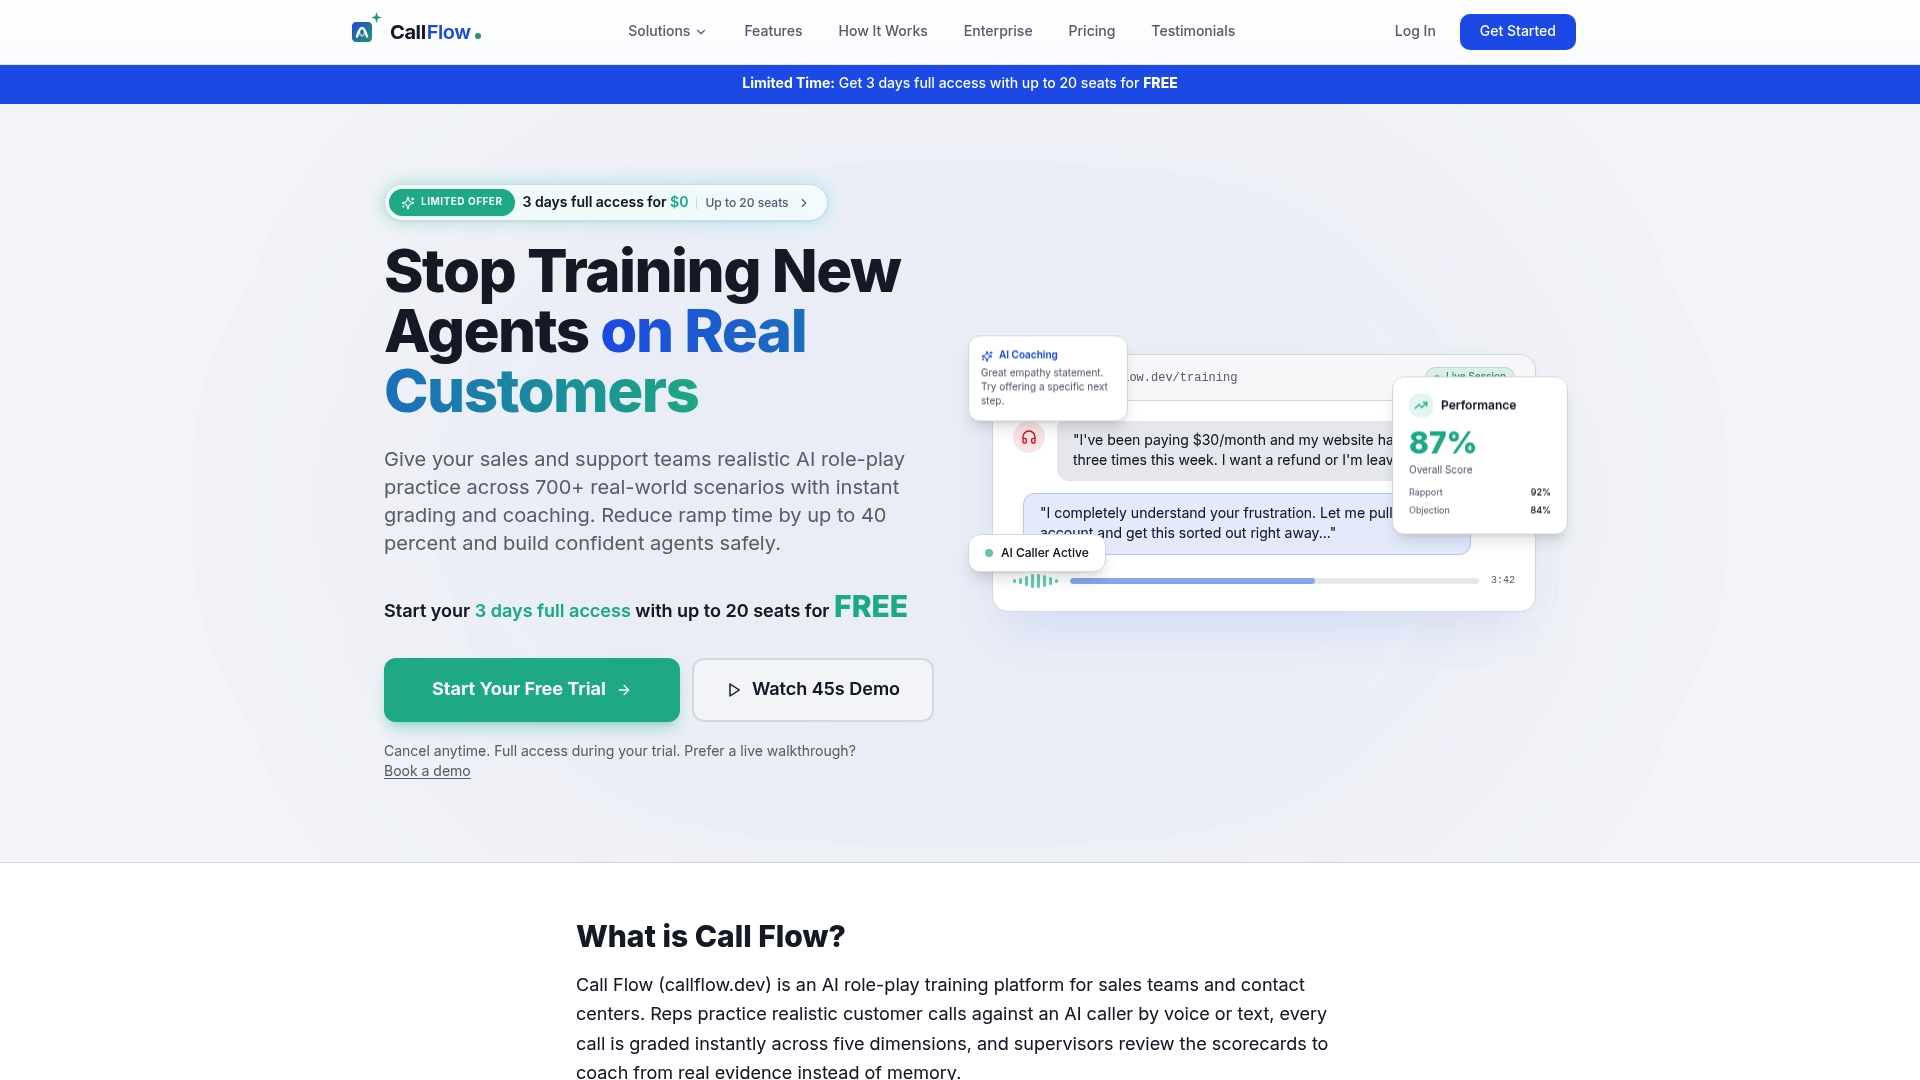
A sensible pilot design mirrors what we outlined above: one cohort of new hires, one full ramp window, and a frozen quality bar as your stop event. Callflow's instant grading and coaching feedback removes the lag between a rep's practice attempt and knowing exactly what to fix, which is where most of the wasted ramp days come from. Teams running this approach have reported ramp times shrinking dramatically and resolution rates climbing well past their prior baseline. You can test AI mock-call practice with your own scenarios during a risk-free trial and measure the effect against your current cohort before committing to anything.
Frequently Asked Questions
What is a good time to proficiency benchmark? Benchmarks vary heavily by role complexity and industry, so compare against your own historical cohorts and role-specific segments rather than a single company-wide number.
How is time to proficiency different from a learning curve? A learning curve describes the shape of improvement over time. Time to proficiency is the single number, in days, that marks where that curve crosses your defined performance threshold.
Should I count employees who quit before reaching proficiency? Yes, track them as a separate leaver metric rather than excluding them, since dropping them from your average hides real ramp and retention problems.
How often should I report on time to proficiency? Most teams report at regular intervals, depending on how complex the role is and how long a full ramp cycle typically takes.
Can AI role-play tools actually reduce ramp time? Structured practice with instant, multi-dimensional feedback gives reps more repetitions and faster correction cycles, which some frontline programs associate with shorter ramp windows when piloted against a control group.